Dashboard
Introduction
The dashboard provides users with visual data statistics and export capabilities for file translation services. It supports time-based views of file counts, file format distribution, translation trends, project data, and user rankings, helping users quickly understand business operations.
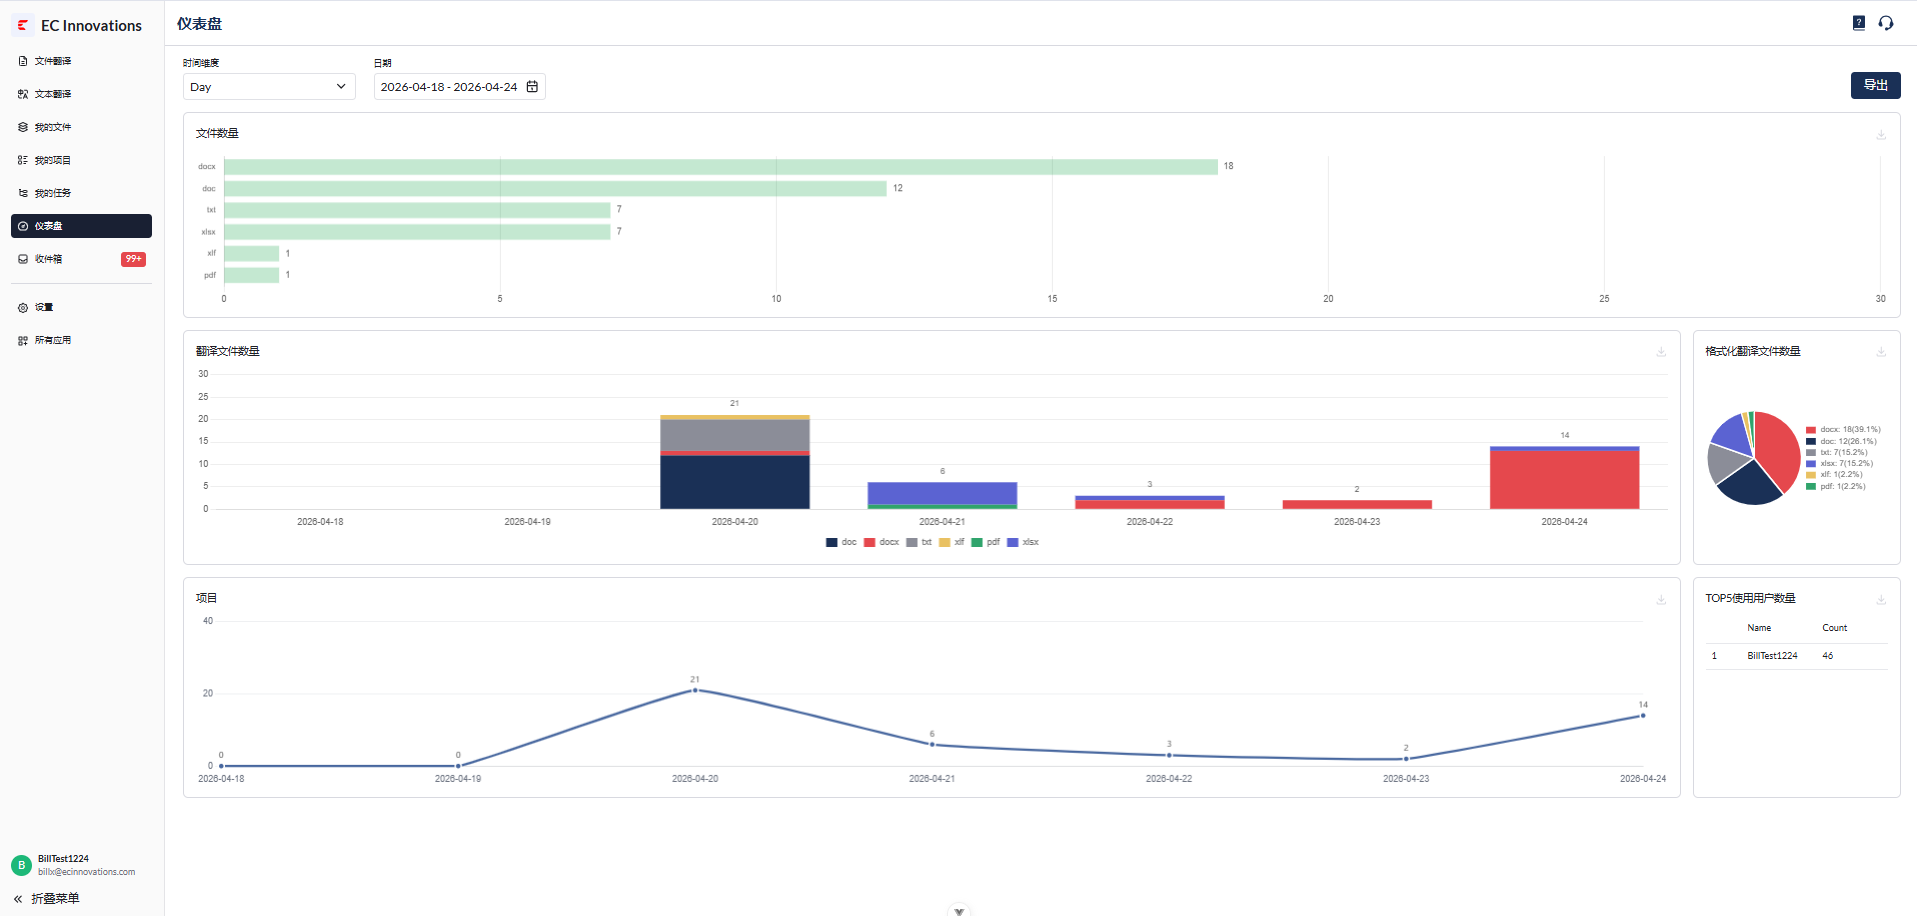
Note: This module is only visible to users with the administrator role. For special requirements, please contact us.
Time Filter Module
Time Dimension Selection: Supports data statistics by day or by month.
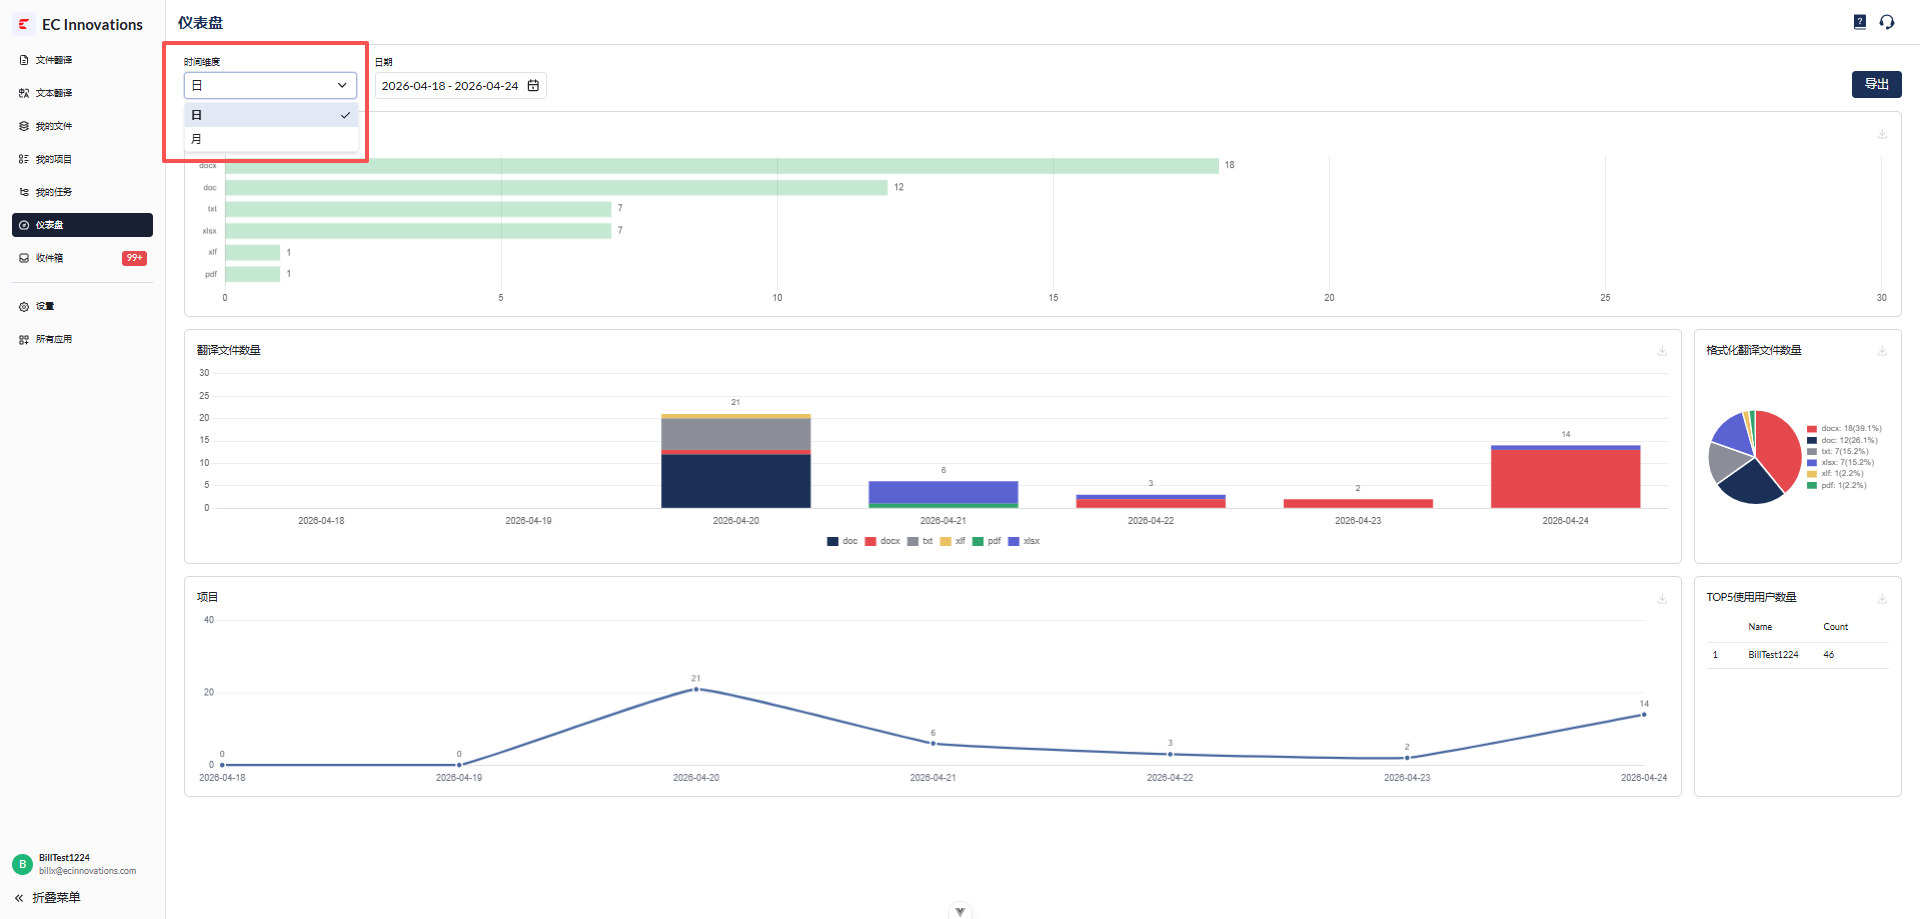
Time Range Selection: After selecting a date, the system displays data from the most recent seven days by default. After selecting a month, it displays data from the most recent seven months by default. Users can also select a custom range manually. When the first day is selected, the available end date can be selected within 11 days before or after that date, allowing users to view up to 12 days of data. The same logic applies to monthly selection.
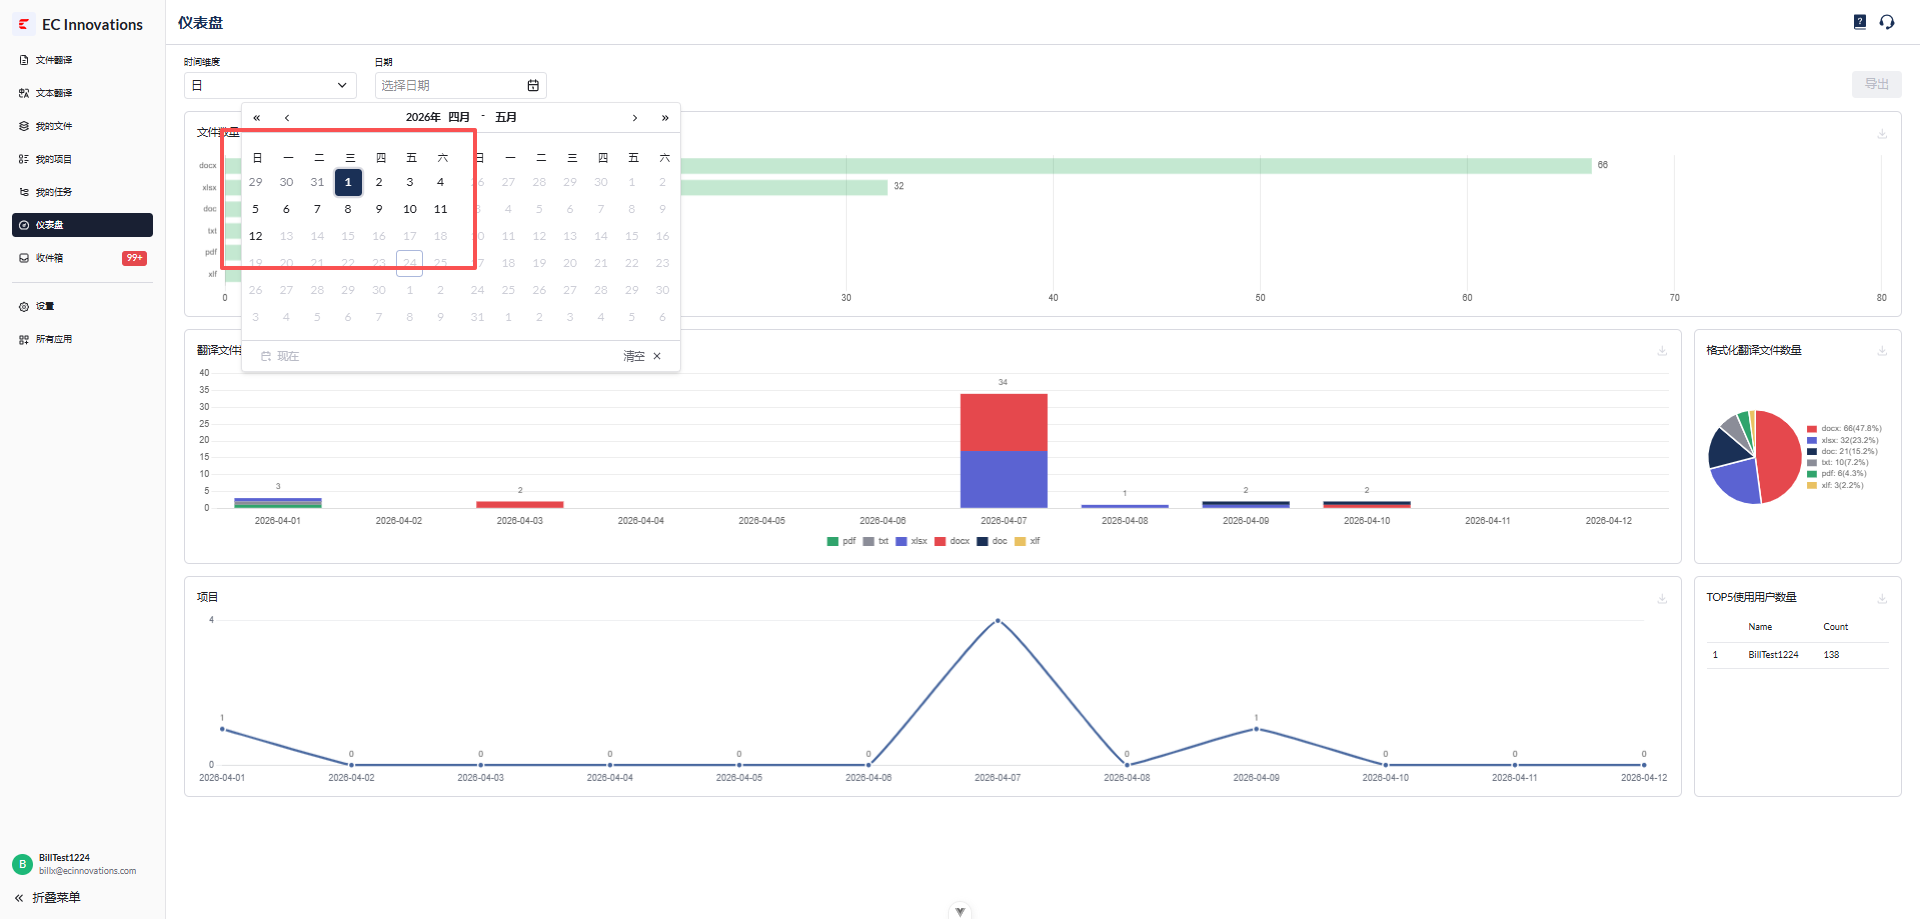
Chart Module
- File Count: Shows the total number of files by format.
- Translated File Count: Shows the format distribution and count changes of translated files by date.
- Formatted Translated File Count: Shows the proportion of each file format in a clear visual format.
- Projects: Shows file count changes by project and date.
- Top 5 Users by Usage: Shows the top five users who created projects.
Export
- File Count and Top 5 Users by Usage are exported as Excel files. The other three chart types are exported as PNG files.